Case study SQL Server 2014 and BWIN

Etiquetas

, , ,

SQL server speed

Sometimes people ask me about SQL Server case studies for that reason today I want to share with you an important case study which tells the experience of BWIN.

BWIN is an online digital entertainment company bwin.party provides online gaming and other offerings to almost 2 million people. Because the organization needed a better ability to support rapid business growth and improve website performance, it deployed an in-memory online transaction processing (OLTP) solution in Microsoft SQL Server 2014. The company can now handle 250,000 requests per second and can offer players a faster, smoother gaming experience. bwin.party also expects to save as much as US$100,000 on hardware costs and is increasing revenue.

This is the link to the case study.

Also you can see this video where BWIN talks about its experiences.

SAP Business Objects: Designing Universe with the information design tool

Etiquetas

,

iphone_business_objects_explorer

The Business Objects Universe is a semantic data model between users and database that stores organization data, this semantic layer contains Objects that represent dimension, detail and measure.

Some advantages of Universe or Semantic Layer are:

1. The objects are represented in Business Terminologies which makes easy for them to create a report.
2. Users don’t need to knowl SQL. Business User can simply drag drop the objects and the tool will generate the required query to fetch the data.
3.Integrated security: All types and security can be applied on Universe making it data secure and only available to related person.
4.Intuitive interface for developers and end-users
5.Maintenance/change management: With the universe model all of your logic is in one place, making maintenance straightforward.

Fundamentally, the universe enables the end-user of BusinessObjects to interact with data without having to understand the complexities of database logic or be familiar with where the physical data is stored.

Now for create your fist Universe we need to open de Information design tool and then go to File>New>Projet

A Project will allow us to organize and maintain the different object needed to create the universe.
Keep reading

Creating a twitter analytical solution Part IV (Exploring the data)

Etiquetas

tweets report

To explore the data that we stored in the cube we need to open an excel file and create a data connection to our cube. In order to do that we need to follow the next steps:

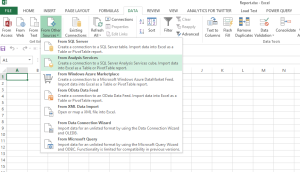
Go to the Data tab and in the “From other source” options choose From Analysis Services

Create data connection

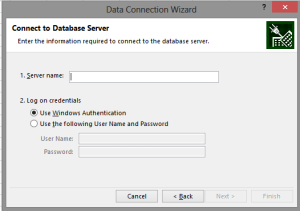
Indicate the name of your server instance

Create data connection 2

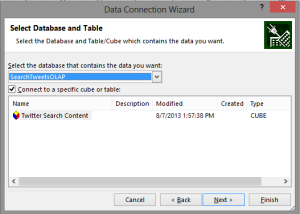
Select the cube that you want to use

Create data connection 3

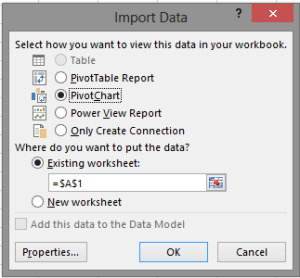
Now you can choose between insert a Pivot Table, a Pivot Chart or a PowerView Report, I will begin inserting a Pivot Chart

Create data connection 4
Keep reading

SAP Business Objects: Using the Business View Manager

Etiquetas

,

Business_Objects1

The business view manager allow you to create a semantic layer composed of different business elements that could be represented by tables in different data sources (Ex: Oracle, DB2,SQL Server) and after that use this semantic layer to build Crystal Report Reports, In this post we’ll see how to create Data Connection, Business View and Business Elements objects.

 To use the Business View Manager you need to install the SAP BusinessObjects BI Platform Client Tools.

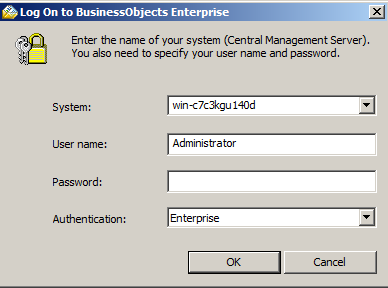
To create our Business View we need to open the Business View Manager and log on.

1

Keep reading

3D data visualization using PowerMap for Excel

Etiquetas

PowerMap is an Excel add-in originally named GeoFlow that allow us to visualize data in a 3D map.

To use PowerMap you only need to download the add-in from here and install it.

After the installation your will see in your Insert tab in Excel a new option name Map

MAP

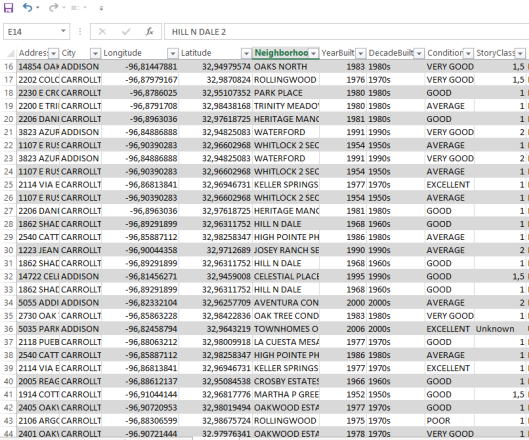
To use it you only need to select a set of data that include geo localization data like city, country, longitude, latitude, etc. For example.

data map

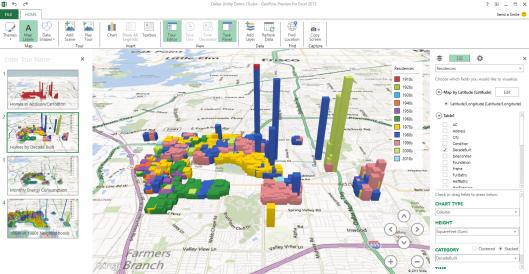
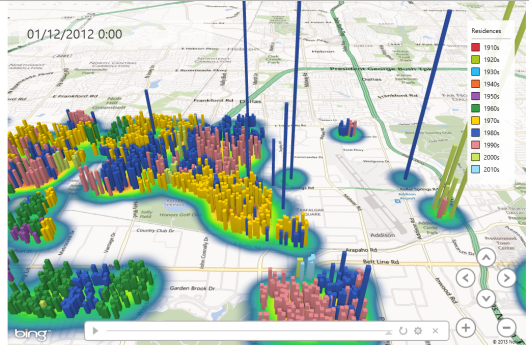
And click the Map option in the Insert Tab and you will be able to create data visualization like this.

power map1

power map2

if you want to try PowerMap I recomend you to download some of the sample data sets that  you can find here

Creating a twitter analytical solution Part III (Creating the Cube)

Cube

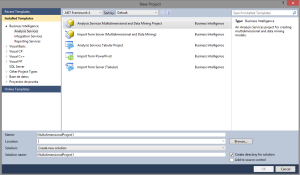
The third part of the solution is based on an OLAP Data Base, to create it  we need to open Visual Studio Data Tools and create a new project using the Analysis Services Multidimensional and Data Mining Project Template.

SSAS creating project

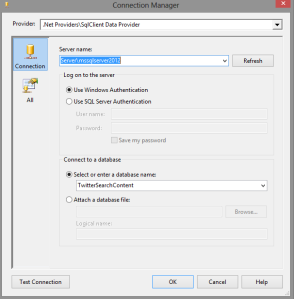
Once created the project we need to add a new Data Source that use the Data Base that we created before (Part I) and that should be filled using the .Net application created in the part II of this series of post.

Connection manager

The next step is to create the Data Source View, in order to do this you need to do right click on the Data Source Views Folder of the solution and follow the wizard selecting the Data Source that was created before.
Keep reading

Installing SAP BusinessObjects Business Intelligence Platform 4.0

Etiquetas

sapbo

Today I’m going to start a series of post talking about Business Objects the product offered by SAP to create Business Intelligence solutions. Let’s begin.

The first thing we need to do is to download SAP Business Objects Business Intelligence Platform 4.0 SP2 free trial from here. We need to sign up to be able to download the product, after the registration process you will receive a temporary product key that you will use during the installation process.

Once downloaded the product we need to uncompress  the rar files and execute the setup file located in .. \51041019_5\SBOP_BI_PLAT_4.0_SP02_ADD_WIN__32B_\DATA_UNITS\BusinessObjectsClient

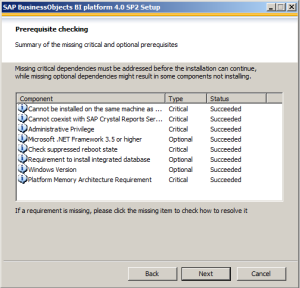
At the beginning of the installation the setup will check the pre requisites components:

SAP Business Objects1
Keep reading

Creating a twitter analytical solution Part II (The .net Application)

Etiquetas

twitter-icon

In order to create the .Net application that will connect to the twitter API we will need a developer account. We can create the account at the twitter developer’s site (https://dev.twitter.com/).

In this  link you can find a post that explain how to create a twitter account and get  the Consumer key, Consumer secret, Access token and the Access token secret, these key will allow us to connect to the twitter API.

Now we need to create a console application, in my case I’m using Visual Studio 2012 and .Net 4.0

The Main method

This is the entry point of the application, it ask to the user for the search criteria and the crawling time.

We must remember that the Twitter Search API will not return tweets over 6 days ago, for that reason this application is designed to collect  results in real time, also we’ll get always the more recent tweets in groups of 100

You can read more about the API limitations here https://dev.twitter.com/docs/using-search
Keep reading

Creating a twitter analytical solution Part I (The Data Warehouse)

Etiquetas

twitter-stats

This is the first post of several post where we are going to see how to develop an analytical solution to explorer data from twitter. The solution will be composed of three sub-solutions:

  • A Data Base that will work as a Data Warehouse and will storage the data crawled from twitter.
  • A .Net application that will be able to read data from the Twitter API and store it into a SQL Data Base.
  • An Olap Data Base that will have a Cube from which we’ll be able to explorer the data.
  • And finally and Excel File with different pivot charts and PowerView Charts where we can see how to explore the data from the cube.

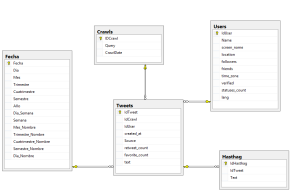
Here is the data model that we’ll use and that we should create in SQL Server.

TwitterDataWareHouse

The tables that we have are the next ones :

Crawl: storage information about every time we run the .net application that download the tweets related to a specific search term.

Tweets: storage information about the tweets downloaded for the .net application

Hashtags: storage information about every hashtag in a tweet.

Users: storage information about the user who create the tweets.

In the next post we are going to see how to create the application that will allow us to fill the data base with the tweets that match our search criteria.

How to create a Map/Reduce Job using .NET SDK for Hadoop

Etiquetas

,

mapreduce

The last post we see how to load and query data using hive, this time we going to use the .NET SDK for Hadoop for the same purpose.

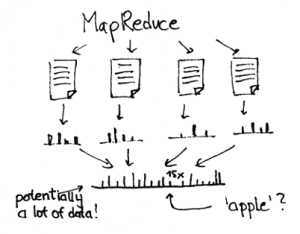
In this case we are using the SDK for Hadoop this allow us to use Map/Reduce Jobs to query data in a distribute file system environment that can be composed for hundreds or thousands of nodes. MapReduce is a programming model for processing large data sets being typically used to do distributed computing on clusters of computers.

 In a typically Map/Reduces program we can find two class the mapper and the reducer.

The mapper: this is the collection data phase, in this phase the Mapper breaks up large pieces of work into smaller ones and then takes action on each pieces.

The Reducer: this is the processing phase. Reduce combines the many results from the map step into a single output.

Keep reading